The Carbon Cost of Convenience
Are Pump Dispensers Worse for the Climate Than Tubes?
Packaging often gets the most attention in sustainability discussions around personal care products. But how much does packaging size and format actually affect a product’s carbon footprint?
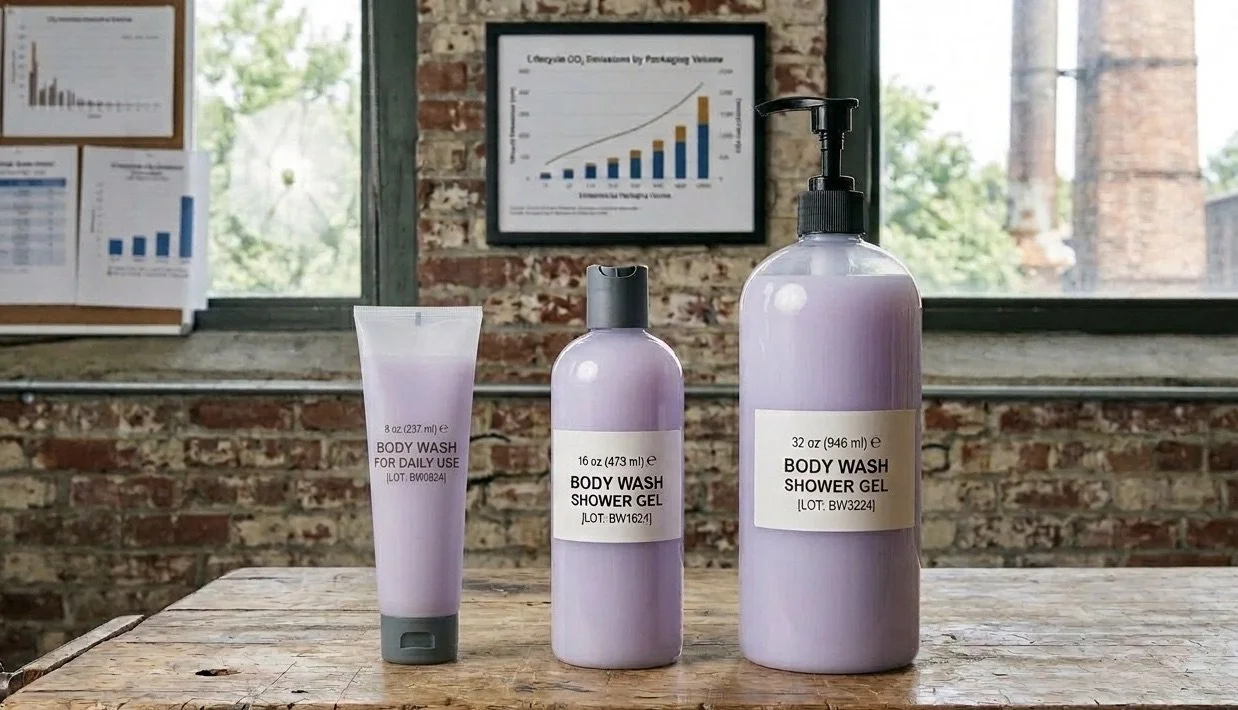
We examine this question in a case study that evaluates the carbon footprint of a plant-based liquid body wash sold in three commonly seen packaging formats:
8 oz squeeze tube
16 oz flip-cap bottle
32 oz pump bottle
The formulation is assumed to be the same in all three cases. To avoid referencing any specific brand, the formula is modeled on a typical natural body wash composition using coconut-derived surfactants, glycerin, aloe, and botanical extracts.
The goal is to understand how packaging design influences the carbon footprint of delivering body wash to consumers.
Fair Comparison of Different Packaging Sizes
Because the three containers hold different amounts of product, comparing their total carbon footprints directly would be misleading — a 32 oz bottle will always have a larger total footprint than an 8 oz tube simply because it contains more product.
To allow a fair comparison, our analysis uses a functional unit, a fundamental concept that is central to life cycle assessments. In this study, we used the following functional unit:
1 ounce of body wash delivered to the consumer
This approach allows us to compare how efficiently each packaging type delivers the same amount of product.
What Was Included in the Analysis
This is a screening-level life cycle assessment focusing on ingredients and packaging materials.
Included
Production of body wash ingredients
Production of plastic packaging materials
Container components (bottles, tubes, caps, pump mechanisms)
Not Included
Factory manufacturing energy
Transportation and retail distribution
Consumer use phase
End-of-life disposal
While simplified, this scope generally captures the largest sources of emissions for liquid personal care products.
Estimated Carbon Footprint of the Body Wash Formula
A representative natural body wash formulation was modeled using typical ingredient categories:
water
coconut-derived surfactants
vegetable glycerin
aloe vera
botanical extracts
essential oils
preservatives and thickeners
Using common life-cycle emission factors for these ingredients, the estimated footprint of the formula was derived to be:
≈ 1.26 kg CO₂e per kilogram of body wash
This equals roughly:
35.7 grams CO₂e per ounce of product
Comparing the Three Product Sizes
The following table shows the total carbon footprint, including packaging and ingredients, of the three products:
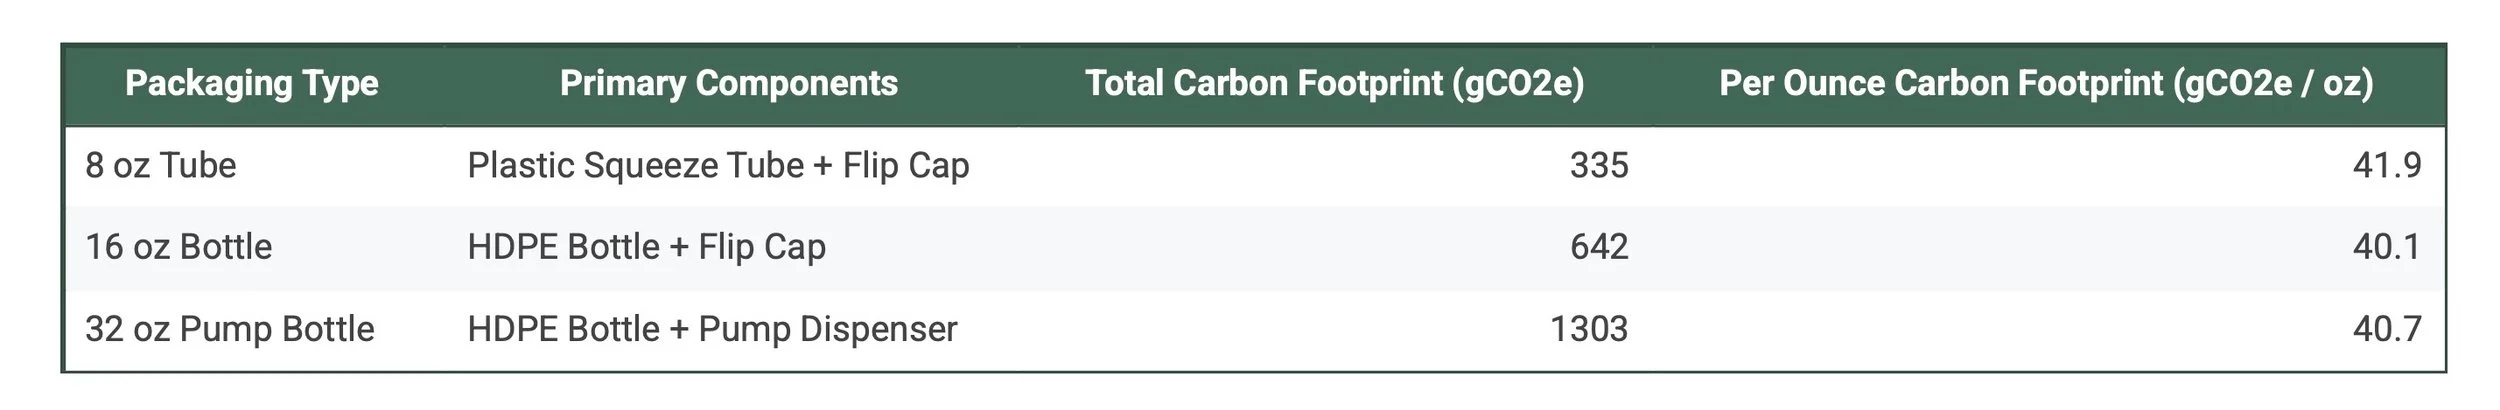
Primary Packaging Components: Pump dispensers contain multiple plastic components and sometimes small metal springs, making them more material-intensive than standard caps.
Total Carbon Footprint: At first glance, the largest bottle (32 oz pump dispenser) appears to have the highest footprint at 1303 gCO2e. But this is simply due to the fact that it contains much more product.
Carbon Footprint Per Ounce of Body Wash: Normalizing results using the functional unit (1 oz of product) produces a clearer comparison — 16 oz bottle is marginally better than the 32 oz pump bottle while the 8 oz squeeze tube is worse than the other two products although not by much.
Key Insights
Ingredients dominate the footprint
The body wash formula accounts for roughly 85–90% of total emissions.
Packaging typically represents 10–15% of the total footprint.
This means formulation choices usually matter more than packaging when it comes to carbon impact.
Most efficient packaging
The 16 oz bottle shows the lowest carbon intensity in our example.
It benefits from a favorable product-to-packaging ratio while avoiding the extra materials used in pump dispensers.
Pump mechanisms add emissions
The 32 oz pump bottle contains more packaging material than the 16 oz bottle because of the multi-component pump assembly. This slightly increases its carbon footprint per ounce.
Small containers have higher packaging impact
The 8 oz tube has the highest carbon intensity because the packaging represents a larger share of the product weight.
What This Means for Product Design
For liquid personal care products, three general lessons emerge:
Larger containers typically reduce packaging emissions per unit of product
Pump dispensers increase packaging complexity and material use
Ingredient sourcing usually has a greater impact on carbon footprint than packaging changes alone
Cost vs Carbon: Why Price and Emissions Don’t Align
One interesting question is whether the carbon footprint of body wash tracks with its price. In retail, larger sizes almost always have a lower price per ounce. Intuitively, you might expect them to also have a much lower carbon footprint per ounce.
However, this analysis shows that the relationship is much weaker.
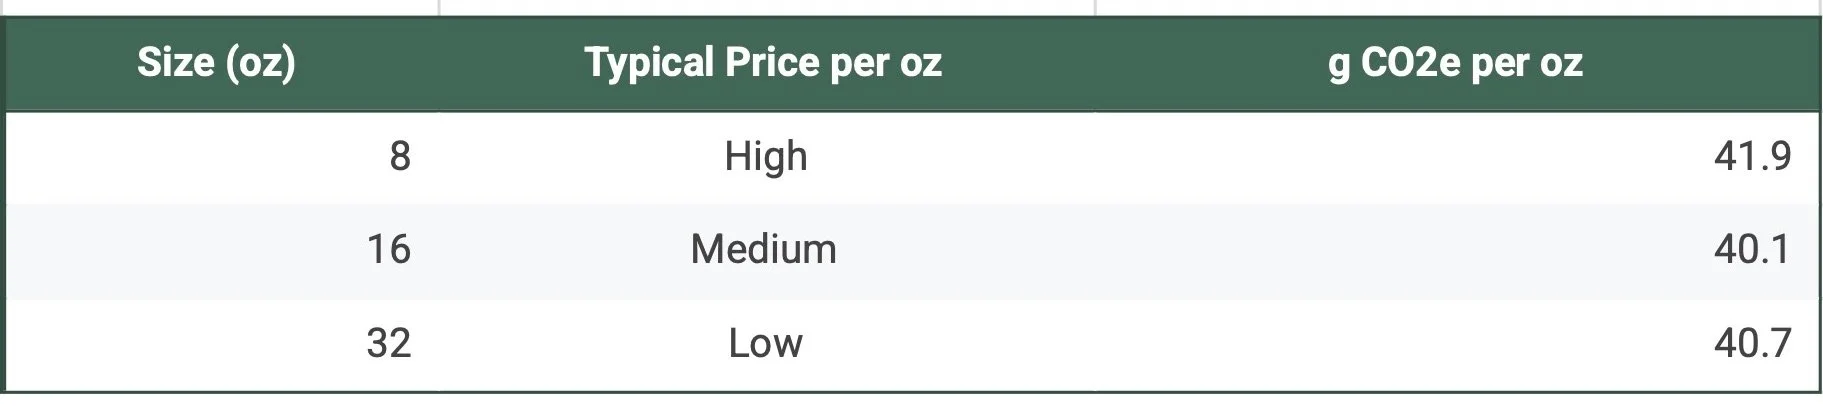
At play here are the strong economies of scale — larger packages are significantly cheaper per unit of product. On the other hand, for emissions, the difference is relatively small — only a few grams of CO₂e per ounce across sizes.
Why the difference?
The key reason is that cost and carbon are driven by different factors.
Carbon footprint is dominated by the ingredients (about 85–90% of total emissions)
Price is heavily influenced by non-material costs, including:
manufacturing and filling operations
packaging assembly
transportation and distribution
marketing and branding
retailer margins
Because ingredients scale directly with product volume, the carbon footprint per ounce remains fairly constant across sizes.
But many costs do not scale linearly. Fixed costs — like production setup, labeling, and retail overhead — are spread across more product in larger containers, driving down price per ounce.
This disconnect between cost and carbon is common across many consumer packaged goods and is an important consideration when evaluating sustainability claims or making purchasing decisions.
The role of packaging
Packaging does influence both cost and carbon, but in different ways.
Larger containers use more material, but less per ounce of product
Pump dispensers are more complex and costly, but only slightly increase carbon emissions compared to simple caps
This means packaging contributes more noticeably to price differences than to carbon differences.
Key Takeaways
Packaging choices do affect a product’s carbon footprint, but the biggest driver for liquid body wash is the production of the ingredients themselves.
Improving formulation sustainability and optimizing packaging together is the most effective strategy for reducing the overall environmental impact of personal care products.
Consumers are strongly incentivized to buy larger sizes from a cost perspective, but the climate benefit of doing so—at least for liquid personal care products—is relatively modest.
How We Can Help
Each product is unique and requires its own analysis. We use screening LCAs like this to help brands:
Identify carbon hotspots quickly
Compare alternative strategies side by side
Focus resources where they deliver the greatest return
Whether the goal is reformulation, packaging optimization, or portfolio-level planning, the same principles apply.