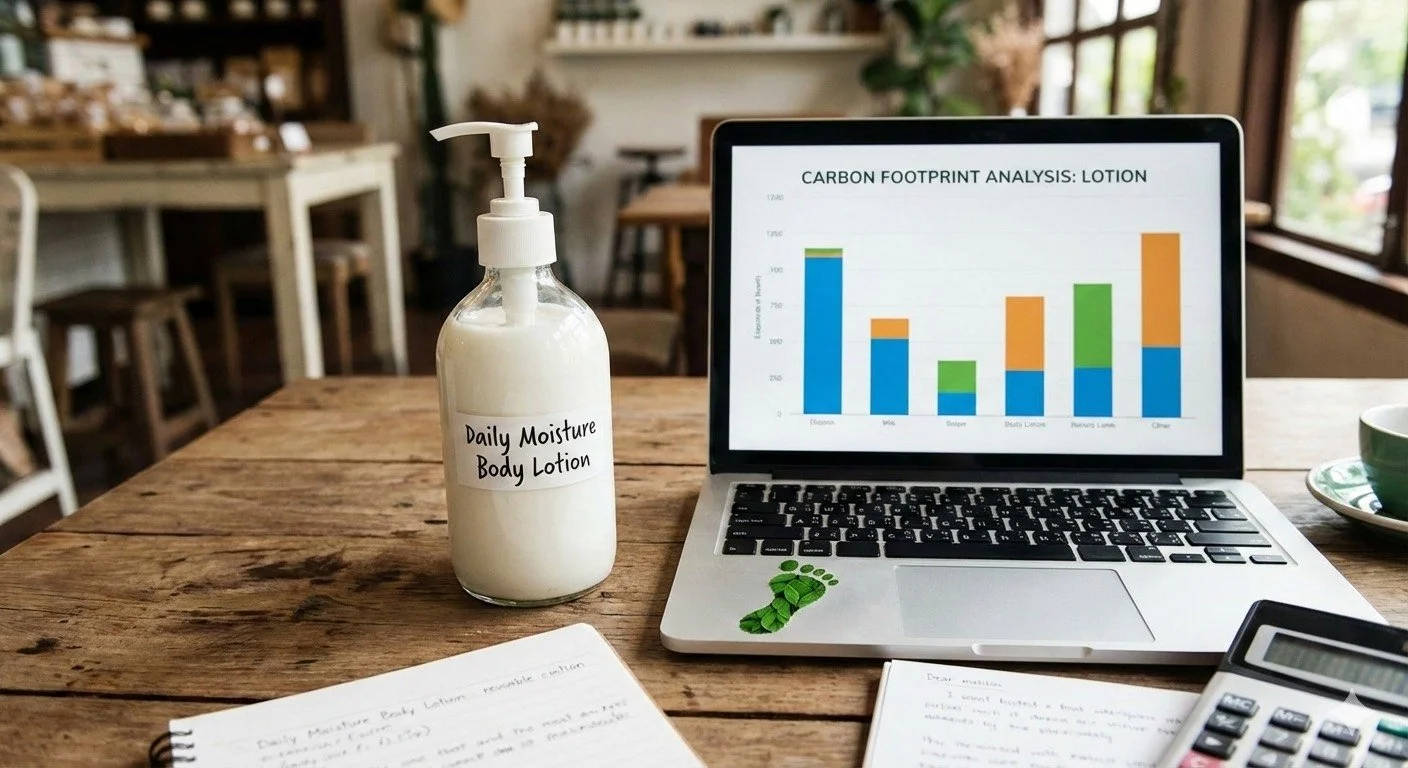
Carbon Footprint Analysis of a Mass-Market Body Lotion
The Opportunity
Personal care brands are under increasing pressure to reduce product carbon footprints — but many struggle to identify where emissions actually come from and which changes matter most.
This case study demonstrates how a screening-level lifecycle analysis can uncover high-impact, cost-neutral reduction opportunities in a mass-market body lotion sold at multi-million-unit scale.
What We Analyzed
Product:
32 oz (≈0.95 kg) hand & body lotion
High-volume, globally sourced ingredients
Scope included:
Ingredient production
Primary packaging
Upstream transportation of raw materials
Scope excluded:
Consumer use
End-of-life
Corporate overhead
The goal was speed, insight, and decision relevance — not perfect precision.
Where the Carbon Footprint Really Comes From
Most emissions are baked into the formulation and packaging, not shipping distance.
Emissions Breakdown:
Ingredients: ~0.95 kg CO₂e
Packaging: ~0.35 kg CO₂e
Raw material transport: ~0.05 kg CO₂e
Manufacturing energy: ~0.05 kg CO₂e
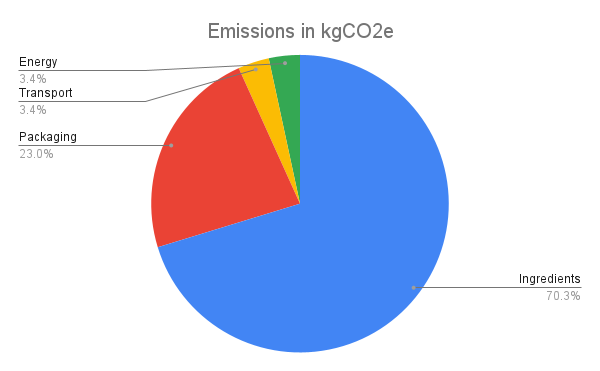
Headline takeaway:
Ingredients alone account for over 60% of total product emissions.
This immediately tells brands where to focus.
Ingredient Insights (Anonymized)
To protect product confidentiality, ingredients are grouped into functional categories:
Purified water
Bulk plant oils (primary & secondary emollients)
Lightweight esters
Fatty alcohol / emulsifier system
Botanical extracts
Essential oil fragrance
Vitamins, preservatives, stabilizers
What surprises most teams
Some botanical extracts and essential oils show very high kg CO₂e per kg, but they contribute little to the total footprint because they’re used at low levels.
The real drivers are bulk oils and structuring agents.
Transportation: Important — but Not the Main Lever
Despite global sourcing:
Most ingredients ship by ocean freight
Water is assumed to be sourced locally
No air freight assumed
Result
~0.05 kg CO₂e per bottle
≈ 3–4% of total footprint
This confirms a common LCA insight: what ingredients are made from matters more than how far they travel.
Reformulation Scenario: Real Reductions, No Trade-Offs
We modeled a practical reformulation strategy that preserves performance, claims, and consumer price.
Changes tested
~10% reduction in total oil phase
Partial substitution of the highest-impact bulk oil
~15% reduction in fatty alcohol / emulsifier loading
No changes to botanicals, fragrance, or actives
No premium materials. No offsets. No greenwashing.
Ingredient Footprint — Before & After
Results:
Baseline ingredients: ~0.95 kg CO₂e
Optimized formulation: ~0.81 kg CO₂e
~15% reduction in ingredient-related emissions per bottle
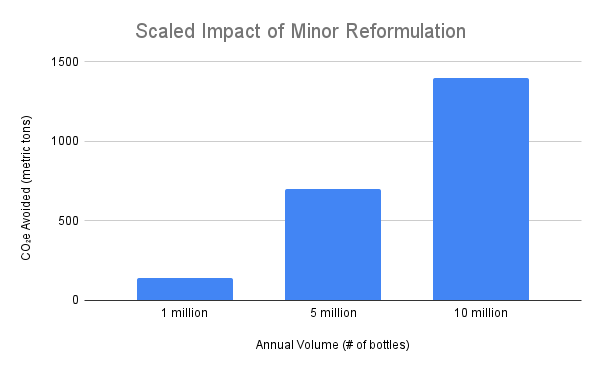
Why This Matters at Scale
For a product shipped in millions of units per year:
Annual Volume ~ CO₂e Avoided
1 million bottles ~ 140 metric tons
5 million bottles ~ 700 metric tons
10 million bottles ~ 1,400 metric tons
Small formulation changes become material climate wins at scale.
What This Case Study Demonstrates
✔ Carbon hotspots can be identified quickly
✔ Ingredient mass matters more than ingredient mystique
✔ Transportation is rarely the primary lever
✔ Double-digit reductions can be cost-neutral
✔ Sustainability and product performance don’t have to compete
Why This Approach Works for Brands
This type of analysis helps teams:
Focus R&D resources where they matter most
Avoid chasing marginal gains
Communicate credible sustainability progress
Make defensible, data-backed decisions early
How We Help
Each product is unique and requires its own analysis. We apply a similar methodology as this case study to:
Analyze your product’s ingredients, formulation and packaging
Compare footprints across alternative ingredients, formulations and packaging
Devise a path of maximum impact and minimum disruption
From screening studies to portfolio-level roadmaps, we help brands move from carbon curiosity to carbon action.