Reformulation vs. Recycled Packaging
Which Strategy Carries Maximum Impact?
Product Type
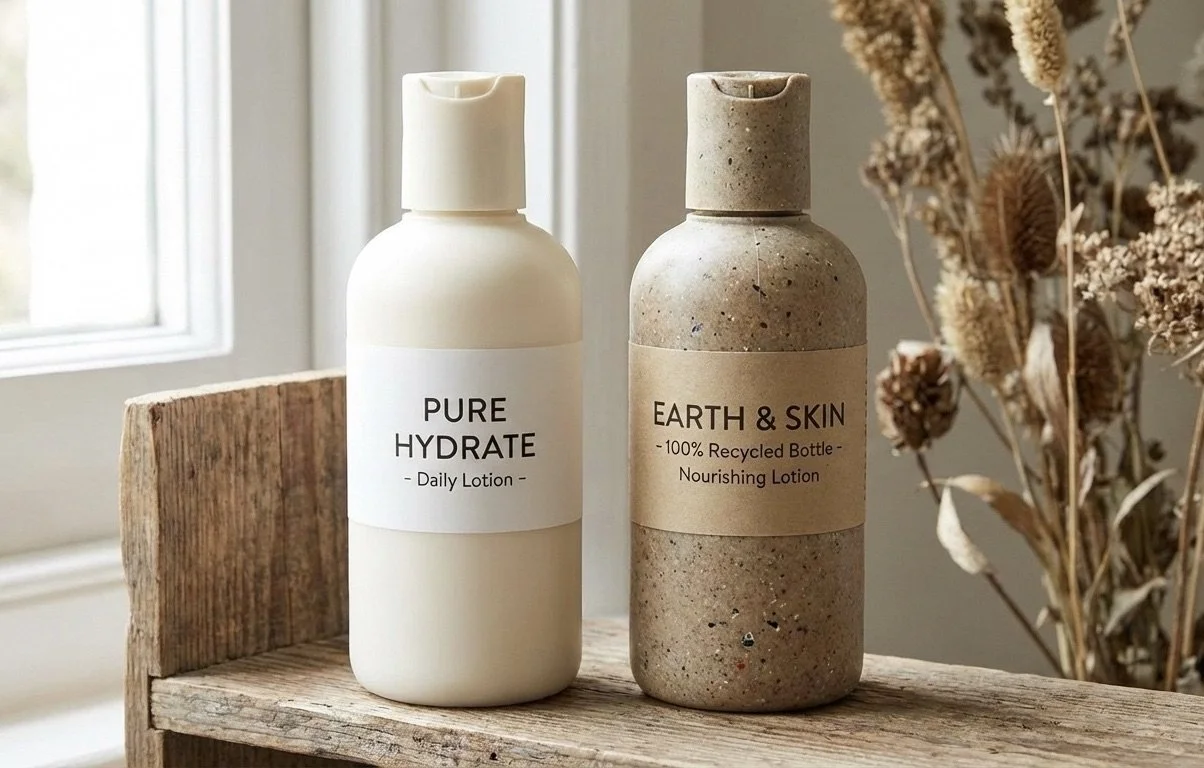
Mass-market hand & body lotion (32 oz / ~0.95 kg)
High-volume consumer product sold at multi-million-unit scale
The Question Brands Are Asking
When brands commit to reducing product carbon footprints, the first question is often:
“Should we focus on reformulating the product — or switch to recycled packaging?”
This case study compares the carbon reduction potential of both strategies, using a representative personal care product as an example.
Scope & Methodology
This was a screening-level carbon footprint analysis, intended to support early decision-making rather than regulatory reporting.
Included
Ingredient production
Primary packaging
Upstream transportation of raw materials
Manufacturing energy (estimated)
Excluded
Consumer use
End-of-life
Corporate overhead
Functional Unit
One 32 oz bottle of lotion
All figures are approximate and based on publicly available emission factors and representative formulation assumptions.
Baseline Carbon Footprint
Per Bottle Emissions (screening)
Contributor ~kg CO₂e
Ingredient production ~0.95
Packaging (virgin plastic) ~0.35
Raw material transport ~0.05
Manufacturing energy ~0.05
Total ~1.35 kg CO₂e
Key Insight
Ingredient production accounts for over 60% of total product emissions, with packaging as the second-largest contributor.
Transportation plays a relatively minor role.
Strategy A: Ingredient Reformulation
What was Changed
A representative reformulation was modeled with no change to product performance, claims, or positioning:
~10% reduction in total oil phase
Partial substitution of the highest-impact bulk oil
~15% reduction in fatty alcohol / emulsifier loading
No changes to botanicals, fragrance, or actives
This approach focused on formulation efficiency, not premium substitutions.
Carbon impact: Reformulation
Baseline ingredients ~0.95 kg CO₂e
Optimized ingredients ~0.81 kg CO₂e
Reduction ~0.14 kg CO₂e per bottle
Result:
~15% reduction in ingredient-related emissions
~10–11% reduction at total product level
Strategy B: Recycled-Content Packaging
What was Changed
Replacement of virgin plastic bottle with high PCR (50–100%) HDPE or PET
No change to bottle weight or format
Packaging Emission Factors (typical)
Virgin plastic: ~2.5 kg CO₂e/kg
PCR plastic: ~1.2–1.6 kg CO₂e/kg
Carbon Impact: PCR Packaging
Baseline packaging ~0.35 kg CO₂e
PCR packaging ~0.20–0.25 kg CO₂e
Reduction ~0.10–0.15 kg CO₂e per bottle
Result:
~7–11% reduction at total product level
Side-by-Side Comparison
Per Bottle Reductions
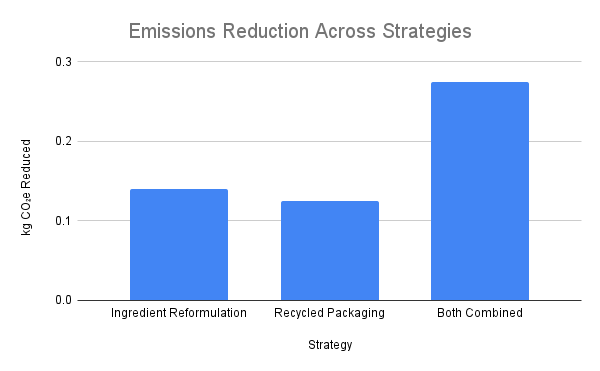
Strategy kg CO₂e reduced % of total
Ingredient reformulation ~0.14 ~10–11%
Recycled packaging ~0.10–0.15 ~7–11%
Both combined ~0.25–0.30 ~18–22%
What This Means for Brands
Key Takeaway
Reformulation and recycled packaging offer comparable carbon reductions — but through different levers.
Reformulation targets embedded emissions
PCR packaging reduces material carbon intensity
Together, they compound into meaningful reductions
Cost & Implementation Considerations
Factor Reformulation PCR Packaging
Consumer price impact Neutral Neutral to slight increase
Time to implement Medium Short
Brand risk Low Very low
Consumer-visible No Yes
Long-term reduction potential High Moderate
Impact at Scale
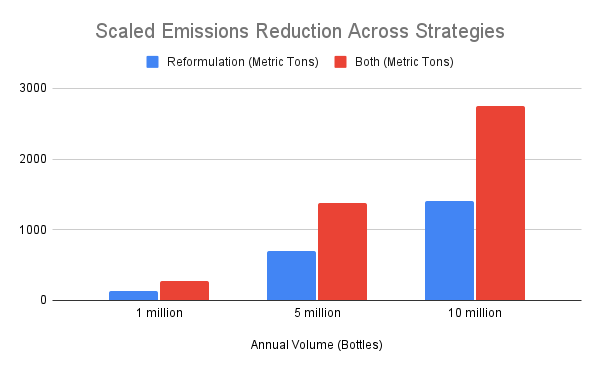
For a product sold at scale:
Annual volume CO₂e avoided (combined)
1 million bottles ~250–300 metric tons
5 million bottles ~1,250–1,500 metric tons
10 million bottles ~2,500–3,000 metric tons
Small per-unit decisions become material climate outcomes.
Why This Case Study Matters
This comparison demonstrates how lifecycle analysis helps brands:
Avoid over-focusing on single “silver bullet” solutions
Prioritize actions by impact, cost, and feasibility
Identify no-regret strategies early in product design
Communicate credible, data-backed sustainability progress
Our Approach
Each product is unique and requires its own analysis. We use screening LCAs like this to help brands:
Identify carbon hotspots quickly
Compare alternative strategies side by side
Focus resources where they deliver the greatest return
Whether the goal is reformulation, packaging optimization, or portfolio-level planning, the same principles apply.